Monday, October 25, 2021

Electric Circuit

electric-circuit
Kirchhoff's Law First Law (Kirchhoff's Current Law) It states that in any network of the conductors, the algebraic sum of currents meeting at a point is zero. In the other hand it is simply means that the total current leaving a junction is equal to the total current entering that junction. Explanation: let us consider 5 currents meeting t a junction P of the network as shown in figure
Let us adopt the following sign conversions for determine the algebraic sign of different currents. All current entering the junction would be taken as positive whereas those leaving it would be taken as negative. So, I1 and I4 would be taken as positive whereas I2, I3 and I5 would be taken as negative. Using Kirchhoff’s of current law we have,I1+(-I2)+(-I3)+I4 +(-I5)=0Or, ∑I=0Also, taking the negative of the expression on one side and positive sign on other side,I1+ I4 = I2+I 3+I5so we can write,total Incoming current = total outgoing currentIin=Iout. Kirchhoff’s Second law (Kirchhofff's Volatage Law): It states that the algebraic sum of all IR drops and EMF in any close loop of network is zero.∑IR =∑EMF=0
Explanation: let us consider a complex circuit given below to find the current at the various part of the circuit we use Kirchhoff’s law. Let us consider the direction of emf and current flow in anticlockwise direction is taken as positive and clockwise direction as negative. According to second law of Kirchhoff’s, we have∑IR =∑EMF For the closed loop AFCBA, (+E1)+(-E2) = (+I1)R1+(-I2)R2 Or, E1-E2 = I1R 2-I1R2 .........................(1) Similarly for closed loop FEDCF E2 –E3 = I2R2-I3 R3 ..........................(ii) Also from first law of Kirchhoff’s, we also have ∑I=0 ans from sign convention we have I3=I2 +I1 ........................................(iii)Solving these equations, (i), (ii) and (iii), we can calculated the required value of pd, current or resistance. Wheat stone bridge’s principle: It is an electronic device which measure accurate resistance of the conductor. it measure unknown resistance with the help of known resistance. Let P, Q and R are three known resistance and X be the unknown resistance are connected in quadrilateral closed electric circuit and the two junction of the quadrilateral are connected with battery and the remain two junction are connected galvanometer and the deflection was not shown by the galvanometer. These conditions called balance condition.
At this condition, Ig= 0 at this condition P
Q
= X
R
Determination for the balanced condition for the bridge: To determine the balance condition the arrangement are shown in figure above. Let us consider the 4 resistance in are arrange in quadrilateral from when it is connected with battery then current is divided into two part i.e I1 and I3 passes through the resistance P and Q. similarly I2 and I4 are passes through resistance X and R respectively. From second law of Kirchhoff’s law for the closed loop ABDA we have I1P + IgRg - I2X = 0 or, I1P + IgRg = I2X ..................(i) Similar for closed loop BDCB we have, IgRg + I4 R - I3Q = 0or, I3Q= IgRg + I4R ......................(ii) Again from first law of Kirchhoff’s at point D I2 + Ig = I4 ..................(iii) Similarly at B we have I1 = Ig +I3 .................(iv) Now at balance condition Ig=0 and no current passes through the galvanometer then above equation (i), (ii), (iii), and (iv) become: I1P = I2X ……………..(v) I3 Q = I4R ………(vi) I2 =I4 ………(vii) I 1 = I3 ………………(viii) Dividing eq. (v) by (6) we have I1P
I3Q
=I2X
I4R
Substituting the values of I1 and I2 from equn (vii) and (viii). I1P
I1Q
=I2X
I2R
or, P
Q
=X
R
This is the expression for the balance condition of the Wheatstone bridge. Meter Bridge Meter bridge is a electric device which is used to measure the unknown resistance. It works on the principle wheat stone bridge circuit.
It consists of 1 meter long uniform wire, A resistance box and unknown resistance are connected in two gaps of meter bridge. A galvanometer is connected along with jockey which is slided over the wire to find the nul deflection. A source is connected across the bridge to maintain current in the circuit. According to the wheat stone bridge principle, P
Q
=R
X
or, Resistance of length AB
Resistance of length BC
=R
X
where, AB= and BC=(100-l)then we have, p and Q(100-)So,
(100-𝜃)
=R
X
X=(100-ℓ)R
l
If the unknown resistance is at the left gap and resistance box is at right gap of the meterbridge then. x=l
(100-1)
R
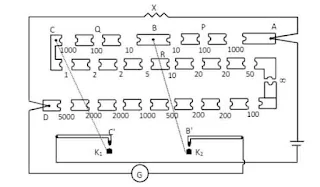
So, the value of X can be calculated for different value of R. P.O BoxPost oflice box is an instrument that works on the Wheat stone baidge principle. It is so called because, this instrument was used to find the resistance of broken telegraph wires in the post office. Potentiometer is electrical sensitive device which is use for following purpose a. To measure emf and internal resistance of cell. b. To compare emf of two cells and p.d between two point of circuit and c. To measure current and resistance accurately of given circuit. P.O Box is a compact forn of Wheat stone bridge more specially a resistance box in which the resistances with in the box serve as three arms of Wheat stone bridge and value of unknown resistance can be found by inserting it in the fourth arm. This box consists of two ratio arms AB and BC which serve as P and Q of the wheat stone bridge and a third long arm CD which serves as the known resistance. An unknown resistance is inserted between A and D whose value is to be determined. Each ratio arm consists of three resistance marked 10Ω,100Ω and 1000Ω inside the box where as the known resistance arm has the resistances ranging from 1 to 5000Ω inside the box. A source of emf is connected betwecn A and C which is connected to C when the key K1 is pressed. A galvanometer is connected between D and B is connected to B by a key K2. while noting the readings, battery key (K1) is pressed first and then Ki is pressed in order to avoid inductive effects in the galvanometer coil.Measurement Procedure
Let an unknown resistance X be connected between A and D.At first, 10Ω resistors are plucked out of each ratio arms P and Q so that, the ratio P
Q
=1
1
Now, the known resistors from arm CD are plucked out so as to observe the deflection in the galvanometer. By changing the value of known resistance gradually, the deflection in the galvanometer changes it direction. If the galvanometer shows left (say) deflection for and right deflection for resistor taken out of CD, then, we say that the resistance lies between and .In second step, the ratio of arms P and Q are maintained at P:Q=10:100. In this case the value of X now nust increase 10 times and hence. We check its resistance correctly betweerı 30Ω and 40Ω by plucking suitable resistors. In this case also, we try to find opposite detlections of galvanometer for two consecutive value of R. It, the galvanometer shows opposite detlection for 36Ω and 37Ω then. we say, the resistance lies between 3.6Ω to 3.7Ω. Sometimes, we may get a null deflection for particular value say 36Ω. In such case we can directly say the value of unknown resistance is 3.6Ω. Finally the ratio P:Q is maintained at 10:1000 by plucking 1000Ω key from Q. The same procedure is repeated as this time by plucking the rcsistance key bctween 360Ω and 370Ω . If a null deflection is obtained for certain value of R, say 361Ω then we say the resistance of the wire is 361Ω. If the null deflection is not obtained and still opposite deflections exist, then we adopt following method to calculate exact value of X, Suppose, for, R=361Ω galvanometer deflects by 2 divisions left and for R =362Ω galvanometer detlects by 1 division right. Total deflection of galvanometer for change in resistance =2+1=3 divisions. Here, 3 division corresponds to 1Ω resistanceor, 1 division corresponds to 1
3
Ω
resistance
or, 2 division corresponds to 2
3
Ω
resistance. Therefore, the value of resistance R required for null deflection =(361+2
3
)Ω=361.66Ω
Thus, the salue of urknown resistance fron wheat stone bridge principle is, P
Q
=x
R
.
a
or, X=P
O
×R
or, X=10
1000
×361.66
X=3.616Ω
In this way, we can determined, the value unknown resistance using P.O Box.

Potentiometer


original image
A potentiometer is an electric device used to measure the emf and internal resistance of a cell, to compare emf of two cells and a potential difference between two points in an electric circuit. It can also be employed to measure the current and resistance in a circuit accurately.
It consists of a uniform wire of manganin or constantan of length usually , kept stretched between copper stripes fixed on a wooden board by the side of a metre scale. The wire is divided into ten segments each of length. These segments are joined in series through metal strips between points and . A steady current is maintained in the wire by a constant source of emf , called driver cell, that is connected between and through a rheostat. A jockey is slided over the potentiometer wire which makes contact with the wire and cell.
let I be the current passing through the potentiometer wire . In a segment AC of the wire, let be the potential difference across it.
Then,
where is the resistance of this segment.
If 1 is the length of this segment, its resistance is
where to the resistivity of the material of the wire and its cross section area.
From and , we have
Since and I are all constant,
then
is a proportionality constant and we can write
The potential difference across any portion of the potential of the potentiometer wire is directly proportional to the length of that portion provided the current is uniform.

Application of Potentiometer
A potentiometer basically measures the potential difference between two points.
1. Determination of Internal Resistance of a Cell
original image
A cell of emf E whose internal resistance is to be determined is connected in the potentiometer circuit. The positive terminal of is connected to where positive terminal of the driving cell is connected and the negative terminal to a galvanometer. A resistance box is connected parallel to the cell through a key . a steady current is passed through the wire by the driving cell.

Initiallly the key is open and the emf of the cell is balanced in the potentiometer wire. Suppose the balanced point obtained at and let be the length of wire AD. Then is balanced by p.d. across AD. So,
From the principle of potentiometer
Now, a known resistance is provided by R.B. and the key is closed. A current l' will pass in the closed circuit of and . then a terminal p.d., is obtained across the cell which is again balanced by the p.d. in the potentiometer wire. Let ' be the point at which the null deflection is obtained and p.d. across be '. So,
If is the length of this portion ' of the wire, from the principle of potentiometer
Dividing equation by equation , we get
and the terminal p.d.,
Substituting these values in equation (iii), we get
As and are known, the internal resistance of the cell can be determined.
2) Comparison of emfs of two Cells and Determination of emf of a Cell
original image
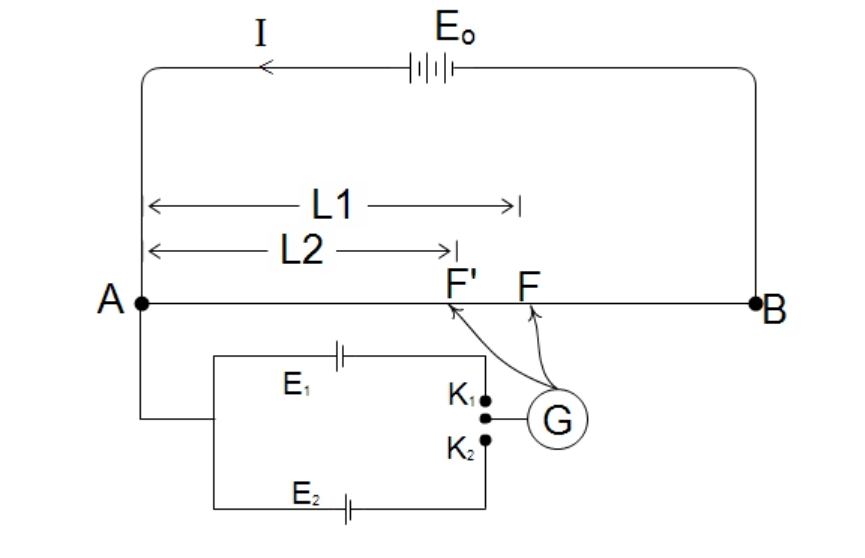
Two cells whose emfs and are to be compared are connected in the potentiometer circuit as shown in the figure. The driving cell of emf maintains a steady current in the circuit of the potentiometer wire . The positive terminals of and are connected at where positive terminal of is connected and the negative terminals to the two-way key. A galvanometer is connected between the key and the jockey that slides over the wire. must be greater than and .
One of the cells say is connected in the circuit by closing of the two-way key and disconnected by making open. The jockey is slide along the wire to find the null point. When the jockey is placed at near on the wire, the length of portion is small and p.d., in it is small. As the emf is greater than , the current will flow through the galvanometer, G in the direction of and the galvanometer is deflected in the left direction.
When the jockey is placed at near , the p.d., across portion AD will be greater than and the current will flow through, in opposite direction of So, the galvanometer shows deflection in right direction. This work confirms that the circuit is correct and by trail and error method, a point says is found at which G shows null deflection. At this condition, p.d. across is equal to emf, and in the galvanometer coil. So, whole emf is balanced by the p.d. in the length of the wire. So, at the balanced condition,
From the principle of potentiometer,
So
...........(i)
Similar work is repeated for the next cell, . Then we will get
..........(ii)
Dividing . (i) by Eq. (ii), we get
Sincel l1 and are measured in the potentiometer wire, can be determined.
If the emf of one cell, say is known, the emf of the other cell can be determined as .
Super Conductor SuperconductorA superconductor is an element or metallic alloy which, when cooled below a certain threshold temperature, the material dramatically loses all electrical resistance. In principle, superconductors can allow electrical current to flow without any energy loss (although, in practice, an ideal superconductor is very hard to produce). This type of current is called a supercurrent.
Type of SuperconductorType I (Soft): These are usually made of pure metal. When it is cooled below its critical temperature it exhibits zero resistivity and displays perfect diamagnetism. This means that the magnetic fields cannot penetrate it while it is in the superconducting state.Type II (Hard): These superconductors are usually alloys and which looses magnetization gradually rather than sudden are termed as type II or hard superconductors.Applications of Super ConductorThe applications of superconductors include the following. These are used in generators, particle accelerators, transportation, electric motors, computing, medical, power transmission, etc.Superconductors mainly used for creating powerful electromagnets in MRI scanners. This conductor is used to transmit power for long distancesUsed in memory or storage elements.Super conductors are used in laboratories for ligh level research works.It is used in thin film devices.Perfect ConductorA perfect conductor is an electrical conductor with no resistivity. n a perfect conductor, electric charges are free to move without any resistance to their motion. Metals provide a reasonable approximation to perfect conductors, although, of course, in a real metal a small amount of resistance to motion is present. A perfect conductor is an idealized material exhibiting infinite electrical conductivity or, equivalently, zero resistivity. While perfect electrical conductors do not exist in nature, the concept is a useful model when electrical resistance is negligible compared to other effects. One example is electrical circuit diagrams, in which we assume that the connecting wires have no resistance. Difference between Superconductor and percect conductorSuperconductivity is a phenomenon occurring in real life, while perfect conductivity is an assumption made to ease the calculations.Perfect Conductors can have any temperature, but superconductors only exist below the critical temperature of the material.In perfect conductor, the magnetic flux within the perfect conductor must be constant with time. Any external field applied to a perfect conductor will have no effect on its internal field configuration while in superconductor magnetic flux is expelled out, ie there is no any mangetic field. ShuntShunt is a low resistance connected in parallel with resistance of a galvanometer while converting galvanometer into ammeter.Conversion of Galvanometer into Ammeter Let us consider the resistance of the galvanometer is G, the maximum current measured by the ammeter is I, and the maximum current measure by the galvanometer by passing through it is Ig, then the current passes through the small resistance i.e. shunt S is (I-Ig) as shown in figure
Since the resistance of the galvanometer and shunt are in parallel then a/c to the property of parallel combination we have, Potential difference across shunt = Potential difference across galvanometer (I-Ig)S = IgG Or, S = IgG
I -Ig
……………..(i)
Hence equation (i) gives the value of shunt to convert an galvanometer into a ammeter with range 0 - I ampere Since the S and G resistance are in parallel then the effective resistance of ammeter (RA) is given by 1
RA
=1
G
+1
S
or, RA=GS
G+S
This show the resistance of ammeter (RA) very smaller (lower) then that of shunt S. So, when it is connected ammeter is connected in series in circuit then there is no effect the on current passing through the circuit.Conservation of galvanometer in to Voltmeter:A voltmeter is a device used to measure potential difference between two points in a circuit. It is connected across two points between which the potential difference is to be measured. By connecting a voltmeter in a circuit must not change the current and hence the potential difference in the circuit, a voltmeter should have very high resistance, ideally infinite resistance. Such p.d. measuring device can be made by connecting a very high resistance in series with a galvanometer.
Let G be the resistance of galvanometer and Ig current producing the maximum deflection in the galvanometer. To measure the maximum voltage, V by the voltmeter, the high resistance R is connected in series. So, V = Ig (R + G) Or, IgR = V – IgG. Or, R = V
Ig
-G
This equation gives the value of resistance R, which has connected in series to the galvanometer, and this connection converts the galvanometer into voltmeter of range 0 – V volts. The effective resistance of the voltmeter RV = R + G. Since, R is high, the resistance of the voltmeter RV is high and it will not draw much current from the circuit.Ohmmeter
An ohmmeter is an arrangement which used for measuring resistance. It consists of a meter a resistor and a source connected in series as shown in a figure. The resistance R to be measured is connected between the terminals. The series R is variable, it is adjusted as that when terminals and are short-circuited (i.e. when R→ ), the metre deflects full-scale. When nothing is connected to terminals, so that the circuit is open (i.e. when R=0 ), there is no current and no deflection. For any value of R , the meter deflection depends on the value of R, and the metre scale can be calibrated to read the resistance, so this scale reads backward compared to the scale showing the current. Joule's laws of heating of electric currentHeat produced in a conductor due to the flow of current is(a) directly proportional to the square of current i.e. HI2. ............(i)(b) directly proportional to the resistance of conductor i.e. HR. ..........(ii)(c) directly proportional to the time for which current is passed through the conductor i.e. Ht………. (iii)Combining above all equations, HI2RtH=I2Rt
J
, where J is constant called Joule's mechanical equivalent of heat.
In SI units J = 1. so
H=IRt
Experimental Verification of Joule's Law of Heating
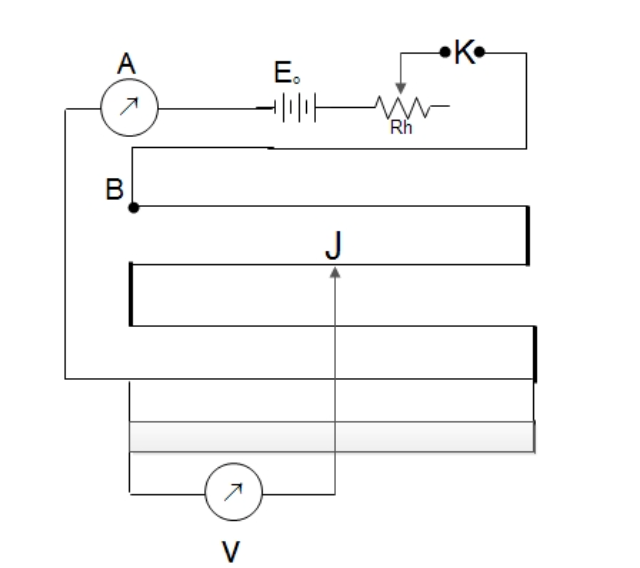
Experimental arrangement for verification of Joule's law of heating is shown in the figure below, where a caloimeter filled with water is taken and resistance wire is immersed in water. A thermometer immersed in the calorimeter records the temperature of water. Here, the rheostat (Rh) changes the current in the circuit. As we pass current by closing the key (k), the resistance (R) becomes hot and this heat energy is absorbed by the water and the calorimeter. The heat absorbed by the calorimeter and the water is given by H=mcsc𝛥𝜃+mwSw𝛥𝜃or, H=(mcSc+mwSw)𝛥𝜃Here, mcSc+mwSw= Constant H𝛥𝜃Now different magnitude of current is passed through the circuit with the help of theostat for equal time and then heat will be produced in the wire and temperature of water rises. It is found that the ratio of heat produced (rise in temp.) and the square of current is always constant.i.e. H1
I 12
=H2
I22
=H3
I23
HI2 ......................(i)
The experiment is repeated again for different length of resistance wire keeping current and time on which current passed constant, it is found that amount of heat produced ie. rise in temperature is directly proportional to the length of the wire used. As the resistance of the wire is proportional to the length.i.e. HR .....................(ii)
Again the experiment is repeated so that same amount of current is passed through the circuit for different interval of time keeping resistance constant. Then it is found that heat produced is directly proportional to the time for which the current is passed ie. H 𝛼 t ..............(iii)
Combining above all equations, H 𝛼 I2Rtor, H=I2RtThis verifies the Joule's law of heating.

Sunday, October 17, 2021

XI Computer Model Question


XI Biology Model Questions


XI Chemistry Model Questions


XI Physics Model Question

Sample Project Report

A PROJECT REPORT ON STUDY BOILING POINT OF WATER


By:

Abc Efg

Grade:………Section:

Roll No:……..


Submitted to:

[Teacher’s Name]

Department of Science

…………………………. School

…………………………

2021


Introduction:

Kinetic theory states that all molecules in matter are in constant motion (Kane and Sternheim, 1984). As these molecules absorb more energy they have a higher amount of random movement. As energy is absorbed in the form of heat the average kinetic energy (temperature) of the molecules will increase except during a phase change. The absorbed energy used in the phase change breaks the attractive forces between the molecules, thus transformation occurs in the orientation of the molecules. An example of a phase change would be the boiling point of water which is a change from a liquid to a gas. This can be observed by using a temperature versus time line graph when the slope becomes zero (plateau) The boiling point of water is expected to be 100.00 oC (Merck, 1976).


Objective:

The purpose of this experiment is to determine the boiling point of water.


Hypothesis:

If the pressure in the classroom is close to 1 atmosphere, then the boiling point of water should be approximately 100 degrees Celsius.


Materials List:

500 ml beaker distilled water, thermometer, hot plate,

Word Processing Software


Procedure:

The required materials were selected and taken to the workstation. The beaker was filled with approximately 300 ml of distilled water. The beaker was gently placed on the hotplate.

The thermometer was placed in the beaker and the initial temperature was recorded. The hotplate was switched on to high.

The temperature was recorded every 2 minutes until 6 minutes after boiling began.

The hotplate was turned off and the materials were allowed to cool for at least 10 minutes before the equipment was dismantled.


Figure 1. The equipment for this experiment was set up as shown in this figure.


Data / Results / Observations:

Quantitative Results

Table 1 Graph displaying data obtained from the heating of water from 0 to 16 minutes


Figure 2. A line graph of temperature versus time of the data obtained in Table 1

Qualitative Results

Numerous small bubbles formed at the bottom of the beaker at 70.6 oC. The size and rate of bubble formation increased as the temperature increased. At 100.0 oC the rate and size of bubble formation remained constant. At that temperature, there was constant production of steam.


Calcuations / Analysis:


Conclusion:

It was determined from the data plotted in the temperature versus time graph (Figure 2) that the boiling point of water is 99.51 oC. This concurs very closely with the stated hypothesis, therefore the experiment was deemed a success. The percent error was found to be 0.49%. Possible sources of error could have involved impurities in the water and human error in reading the thermometer. Possible sources of error may be impurities in the water which may be chemicals from dirty glassware. Improvements would include more accurate thermometers, clean equipment and proper reading of the thermometer.


References:

Kane, Joseph W. and Morton M. Sternheim. Physics. New York: John Wiley & Sons, 1984 ed.

Merck, Josef. Merck Index of Chemical Constants. New York: Benjamin/Cummings Publishing Company Inc. 1976.

Project Report Instruction

 Science Project Report Format

General Information:

·       12 pt Times New Roman font / Fair handwriting

·       Double Spaced

·       1 inch margins

·       Always write in third person

·       Write in Full Sentences except for the materials list

·     Each student should submit at least a project report on a subject. 

Important Reminders for a Project Report 

Ø  Check Spelling

Ø  Use Significant figures and units regarding measurements and calculations Avoid personal pronouns

Ø  Headings should stand out and each section should be separated by 1 line Neatness counts -> use rulers when needed (especially when using tables and

Ø  graphs), type if possible

Ø  Do not copy verbatim (word for word) from the lab handout or any other source. This is plagiarism and would result in a zero mark and possible further consequences.

Title Page - Heading, Name, Class Name, Teacher Name, Date Lab Report

Introductory Paragraph – This section should be written in complete sentences and should connect lab concepts to class content, The introduction should provide background information on the history of the concepts tested, scientists, theories, and any laws tested in the experiment. Cite Sources Used. The introduction should contain any prior knowledge on which the experiment is based including an explanation of principles, definitions, experimental techniques, theories, and laws.


State Problem / Purpose The objective is a concise statement in complete sentences outlining the purpose of the experiment. The purpose section of a lab is where you tell the reader your reason for doing the lab in the first place and briefly summarize any relevant background information about the experiment, including any relevant chemical equations and/or algebraic equations.

Hypothesis: (When your project quantitative: based on data) Possible if_then_ statement. Define any variables such as manipulated, measured, controlled and the cause and effect predicted. The hypothesis is a one-line sentence where you discuss how you’ll solve the problem at hand. The statement after “if” is the independent variable. The independent variable is whatever you will do to solve the problem. The statement after “then” is the dependent variable, because what happens will depend on what you did in the first place. Generally, the dependent variable will be the problem you mentioned in the purpose.

Materials: (Bulleted List) The materials section is a list of all equipment, reagents (chemicals), and computer programs that were used to complete the experiment.

Drawings of the apparatus setup should be included in this section if needed. The materials list must be complete. Indicate how much of each material will be used in the experiment.

If you plan on arranging some of the equipment into a more complex setup (for example, if you are going to heat something over a Bunsen burner, you will need a ring stand, wire gauze, etc.), draw it as well as mention the equipment used.

Procedure: This section may be written in either paragraphs or numbered steps. Explain the test design, and allow for pictures and diagrams. The procedure is a detailed statement (step by step) of how the experiment was performed such that the experiment could be repeated using your report. Safety precautions that were followed should be stated in this section. The procedure must be written in the impersonal (3rd person) past tense:

e.g. We are taking the temperature every 2 minutes. NO

The temperature was taken every 2 minutes. YES


Data / Results / Observations: This is a collection of observations, measurements, multiple trials, data tables, charts, and repeating steps. This section may consist of quantitative and/or qualitative observations of the experiment. A qualitative piece of data is a written description and/or sketch of what was seen during the experiment.

Quantitative information may be in the form of a table or simply a written description. When graphs are required, special attention should be paid to the following items: the type of graph expected (straight line or curve), utilizing the entire graph paper, plotted point size, title of the graph, and axis labels. When numerous measurements have occurred, data is to be placed in a data table whenever possible. Figure headings are placed below the figure and should give a short description of the figure. The figure number should be in bold print. Table headings are found above the table and should also have a brief description.


Analysis / Calculations: Graphs, Error Calculations, Equations, Statistical Analysis - One example of each type of calculation should be included. Results from numerous calculations should be placed in a data table with the proper number of significant figures and correct units. % yield and % error calculations should be included when possible.

Conclusion: The conclusion is a concise statement that answers the objective. The result of percent error and/or percent yield should be discussed and compared with known results. A portion of the conclusion should be dedicated to error analysis which discusses any possible sources of error that may have contributed to the percent error or yield. The conclusion should be written in the impersonal past tense. How to change the experiment for improved results, What did you learn? Explain what the results are telling you, Accept/Reject the Hypothesis, Answer any questions posed by the lab or teacher. A one-line sentence that supports the hypothesis or states that the hypothesis is incorrect.

For example, if you proved the hypothesis that “If I poke myself in the eye, then my eye will hurt”, this first sentence would be “When I poked myself in the eye, it hurt.”

If the hypothesis didn’t work, an explanation of what possibly went wrong. These should be specific suggestions (I should have heated the mixture to 550 C), not general suggestions (I should have heated it more). List at least two possible errors in the lab, as well as ways to prevent those errors in the future. The errors you mention should be errors that you can do something about, not mystical errors that probably did not occur.


Reference: Any information borrowed from another source that is not common knowledge must be cited within the text of the report. The sources should be alphabetical in order.

e.g

Harihar Paudyal, Manoj Kumar Thapa,Arjun Kumar Gautam,Bhesha Raj Adhikari,Parashu Ram Paudel. Principles of Physics Grade XI. Ayam Publication, 2077.


 (https://en.wikipedia.org/wiki/Boiling_point)


Additional Notes:

Reports will be graded largely on their ability to clearly communicate results and important conclusions to the reader. You must, of course, use proper English and spelling, along with comprehensible logic and appropriate style. You should proofread your report as well as spell-check it.

-Neatness and organization will also influence the grade a report receives. Be sure to follow explicitly the format indicated above.

- be concise.

-Avoid qualitative phrases such as "the results were quite close" or "heat fluxes were in good agreement with the correlation." Be as quantitative as possible.

- Do not copy material without citing the source. This includes lab manuals, text books, your neighbor, old labs, etc. Plagiarism, of any degree, will not be accepted.
Biology Project Work

 List of Biology Project Works:

1.       Collect the sample of cryptogams (Algae, Bryophytes, Pteridophytes) and study their

characteristics.

1.       Observe and compare the morphological adaptation of hydrophytes, xerophytes and

xerophytes.

2.       Prepare a report on local varieties and improved varieties of crops and vegetables in your

area.

3.       Visit the forest or vegetation types in your nearby area and prepare a report on it.

4.       Prepare a report on the role of botanical garden in conservation of plants in Nepal

5.       Survey any locality regarding any topics related to theory course of Biology (visit to

zoological museum/zoo/protected areas/natural habits- forest/lake or river) and writing a

report of it

6.       Prepare a report on causes and consequences of environmental pollution in your locality.

7.       Observe different cultivation methods of Mushroom and prepare a report on it.

8.       Look for resources like library, journals, web surfing, field observations etc and study

present status and scope of Biotechnology in Nepal.

9.        Prepare a report on the topic "significances of the biology and biology education with

different sectors i.e. industrial development, medicine, bio-technology, agriculture etc".

10.   Prepare a report on "recent development of genetic field and their implications in human

life"

11.   Prepare model of DNA and RNA

12.   Visit the human beings and observe the dominant and recessive characteristics of human

beings and prepare a report on it

13.   Measure the blood pressure (BP) of human bodies and predict the trends of age wise BP.

14.   Visit the poultry farming or fish farming in local area and prepare a report by including

the place, farming method, marketing etc.

15.   Conduct the survey on common communicable diseases prevailing in local area. Prepare

a report by including the disease, causes, preventing measures.

16.   Prepare a report on trends, causes and consequences of migration in local level.

17.   Prepare functional models of different system of human body.

Chemistry Project Work

 List of Chemistry Project Works:

1.       Observe in your surroundings (kitchen, school, shop, etc.) and make a possible list of organic and inorganic compounds. How are they different? Why is it necessary to study them separately, put your argument?

2.        Study of the methods of purification of water.

3.       Testing the hardness of drinking water from different sources and the study of cause of

hardness.

4.       Study of the acidity of different samples of the tea leaves.

5.       Preparation of molecular models using stick and clay.

6.       Study of adulteration of food materials.

7.       Study of application and adverse effects of pesticides on human health.

8.       Study of use and adverse effects of plastics on environment.

9.       Analysis of soil samples. (elaboration need pH, humus content)

10.   Investigation on corrosion and rusting on iron.

11.   Comparison of ground and surface water quality of a given place-colour, odour, pH,

conductivity, turbidity etc.

12.   Design and development of water filter (Charcoal filter with sand can be designed and

water quality can be monitored).

13.   Observe brick industry/chemical industry/old smooky cooking kitchen/use of

chemical fertilizers/use of insecticides/ vehicular smokes, etc. and draw the

conclusion of environmental impact of the chemical pollution.

14.   Visit nearby paper industry if possible or consult e-media and observe the raw

materials required, steps of manufacturing and quality endorsement of paper. Also,

prepare a complete report.

15.   Visit nearby cement industry if possible or consult e-media and observe the raw

materials required, steps of manufacturing and quality endorsement of cement. Also,

prepare a complete report.

16.   Collect different brands of OPC and PPC cement and observe their setting duration.

17.   Collect different types of plastics (or synthetic polymers) and study the effect of heat

on them.

18.   Extraction of essential oils from selected plants using Clevenger’s apparatus.

19.   Preparation of soap using coconut oil or any vegetable oil.

20.   Study of quantity of casein present in different samples of milk.

21.   Study of formation of rust in the iron nail in various conditions.

22.   Study of the different types of food preservatives used in different food available in

the market.

23.   Study of common food adulterants in fat, oil, butter, sugar, turmeric powder, chilli

powder and pepper.

24.   Investigation on the foaming capacity of different washing soaps and the effect of

addition of sodium carbonate on them.

25.   Study the acidic nature of alcohol and phenol.

26.   Study the distinction between aliphatic aldehyde, aromatic aldehyde and aliphatic

ketone.

27.   Detect the presence of acetic acid in vinegar.

28.   Study the nitrous acid test of primary, secondary and tertiary amines.

29.   Study the different types of dyes.

30.   Study the positive and negative effect of drugs.

31.   Study the setting of cement.

32.   Study the presence of pesticides residues in fruits and vegetables.

33.   Test of protein in various foods.

Physics Project Work

 1. Study the variation in the range of a jet of water with angle of projection

2. Study the factors affecting the rate of loss of heat of a liquid

3. Study the nature and size of the image formed by a convex lens using a candle and a

screen.

4. Study of uses of alternative energy sources in Nepal

5. Study of energy consumption patterns in the neighborhood.

6. Study of study of electricity consumption pattern in the neighborhood.

7. Study of application of laws and principle of physics in any indigenous technology.

8. Verification of the laws of solid friction.

9. Study the temperature dependence of refractive index of different liquids using a hollow

prism and laser beam.

10. Study the frequency dependence of refractive index of glass using a glass prism and

white light beam.

11. Construct a hygrometer using dry and wet bulb thermometers and use it to measure

relative humidity of a given place.

12. Design and construct a system to demonstrate the phenomenon of total internal

reflection (TIR) of a laser beam through a jet of water.

13. Construct a digital Newton meter using the concept of potential divider.

14. Study the traffic noise level in your town using a sound pressure level (SPL) meter.

15. Design and construct a step-up transformer.

16. Construct a simple device to measure angle of contact of a liquid with a solid surface and also calculate the surface free energy of some hydrophobic and hydrophilic surfaces.

17. Calculate the surface free energy of some hydrophobic and hydrophilic surfaces.

18. Construct a simple DC motor using a disk type magnet and a battery.

19. Construct a model of AC generator/dynamo.

20. Construct a current balance to measure magnetic flux density of a U-shaped magnet.

21. Construction of a step down transformer attached with a full wave rectifier made from semiconductor diodes.

22. Construct a thermocouple thermometer and use it to investigate how temperature of a Bunsen burner flame changes with the height of the flame from the top of the burner.

23. Study of the status of hydroelectricity in Nepal.

24. Study of application of laws and principle of physics in any indigenous technology.

25. Verify Joule’ law.

26. Investigation on Peltier effect.

27. History of space exploration

28. Study on history of nuclear power in Asia

Featured Post

Wave simulation