Scientific Study
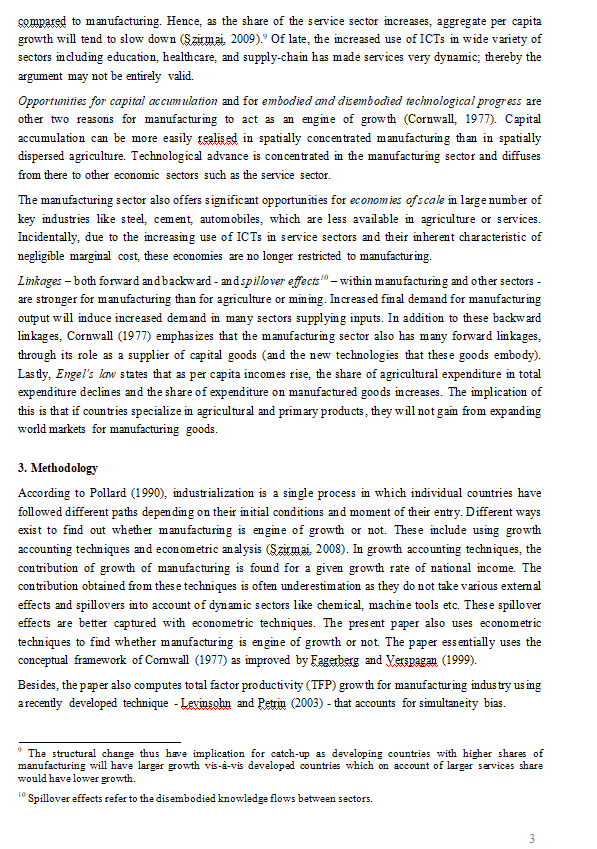
The scientific method is the process of objectively establishing facts through testing and experimentation. The basic process involves making an observation, forming a hypothesis, making a prediction, conducting an experiment and finally analyzing the results. The principals of the scientific method can be applied in many areas, including scientific research, business and technology.
Variables in Scientific Study
As we know scientific study involve process of observation and experimentation, we need to consider some physical quantities that we observe , manipulate or keep consant during our study. Those measurable quantities are called Variables.
Types of Variables
- Independent Variable
- Dependent Variable
- Control Variable
- Here We are observing the "growth of plant" so it is dependent variable.
- In this experiment we study the " growth of plant by changing the amount of "fertilizer" so it is dependent variable.
- The growth of plant also depends upon other factors also like type of seed, amount of water, type of soil etc. So while studying the effect of fertilizer (independent variable), we keep those varables constant. Such variables are called control variable.
Independent Variable
An independent variable is the variable we manipulate or vary in an experimental study to explore its effects. It’s called “independent” because it’s not influenced by any other variables in the study.
Dependent Variable
A dependent variable is the variable that changes as a result of the change in independent variable. It is what we are interested to study, and it “depends” on independent variable.
| Experiment / problem | Independent variable | Dependent variable(s) |
|---|---|---|
| Do tomatoes grow fastest under fluorescent, incandescent, or natural light? | Type of light the tomato plant is grown under | The rate of growth of the tomato plant |
| What is the effect of intermittent fasting on blood sugar levels? | Presence or absence of intermittent fasting | Blood sugar levels |
| Is medical marijuana effective for pain reduction in people with chronic pain? | Presence or absence of medical marijuana use | Frequency of pain Intensity of pain |
| To what extent does remote working increase job satisfaction? | Type of work environment (remote or in office) | Job satisfaction self-reports |
| Independent Variable | Dependent Variable |
|---|---|
| An Independent variable is a variable whose value never depends on another variable. | A dependent variable is a variable whose value depends on another variable. |
| The Independent variable is the presumed cause. | The dependent variable is the presumed effect. |
| Any change in the independent variable also affects the dependent variable. | Dependent variable changes, then the independent variable will not be affected. |
| Independent variables are the predictors or regressors. | Dependent variables are often referred as the predicted variable. |
| Independent variables can become easily obtainable and do not need any complex mathematical procedures and observations. | Dependent variables are obtained from longitudinal research or by solving complex mathematical equations. |
| Independent variables are can be manipulated by the researcher. So he or she is biased. Then it may affect the results of the research. | You cannot be manipulated by the research or any other external factor. |
| Independent variables are positioned horizontally on the graph. | Dependent variables are positioned vertically on the graph. |
Control Variable
- In an experiment or research there must a single independent variable.
- In an experiment or research there must be a single dependent variable.
- All other variables except dependent and independent variables must be kept constant.
- While writing variables in the form of mathematical equation, independent variable should be on right side and dependent variable on left. e.g
s = vt ( s ∝ t)
we are studying the distance covered by a vehicle in different time keeping the velocity constant.
so, t= independent variable
s = dependent variable
v = control variable - In a graph independent varaible is always in x- axis and dependent variable is always in y axis. So a graph shows the variation of dependent variable (x-axis ) with change in independent variable (y-axis).


